

April 6, 2023
March Madness – It’s not just for basketball anymore. The NCAA Men’s tournament produced the first Final Four ever without a number 1-, 2- or 3-seeded team. The financial markets said, “hold my beer.” What started as a relatively calm first quarter ended with an action-packed final month in March. On March 8, Federal Reserve Chairman Jay Powell was testifying before Congress, advocating for another ½ point increase in rates at their upcoming March meeting following a strong labor report and firmer economic data in February. Two days later we had the 2nd largest bank failure in US history as Silicon Valley Bank (SVB) in California was taken over by the FDIC.

And two days after that the 3rd largest failure as regulators assumed control of Signature Bank in New York. Not to be outdone by the run of Cinderella (Florida Atlantic) in the tournament, for good measure, a week later, markets sacrificed a 166-year-old European bank, Credit Suisse (CS). A shotgun marriage was arranged between CS and UBS to avoid any further global banking contagion. Despite all of these headlines, amazingly, stocks and bonds both ended with positive returns for the quarter. (Read more in our Market Commentary.)

Did you miss Walter’s update on the Silicon Valley Bank crash? Catch up now.
One of the reasons for this market recovery is that unlike my basketball bracket where there is no central authority to save me from my terrible decisions, there is the US Treasury, Federal Reserve and FDIC for the banking system. These entities acted quickly and in unison to try to contain the fallout from the US bank failures and also coordinated with their European counterparts to provide liquidity to the global banking system for a very tense two-week period.
Of course, my tournament bracket is not systemically important, so that makes sense. Bottomline, for now, the quick reactions of authorities have resulted in some relative, if still uneasy, calm in the market. However, we believe there are consequences to the events of the past several weeks and we will touch on those and other topics in paragraphs below.
The Federal Reserve’s Lag
Recall that we have discussed in past commentaries and videos that Federal Reserve rate-hiking cycles work with a lag; and these cycles usually continue until something breaks. The question of can the Fed land the plane softly in this cycle was asked by many market participants. If the past is any guide, the chart to the right would seem to indicate that is not likely. This chart shows prior rate hiking periods (blue line of Fed Funds Rate) with the red circles denoting the systemic break that occurred and ended the rate hikes. I think we can add the failure of SVB (and others discussed above) to this chart for this cycle. However, the Fed has not technically stopped raising rates yet. As discussed further in our Market Commentary, they raised rates again on March 22, after the crisis. This is an unusual step, and some would say a mistake.
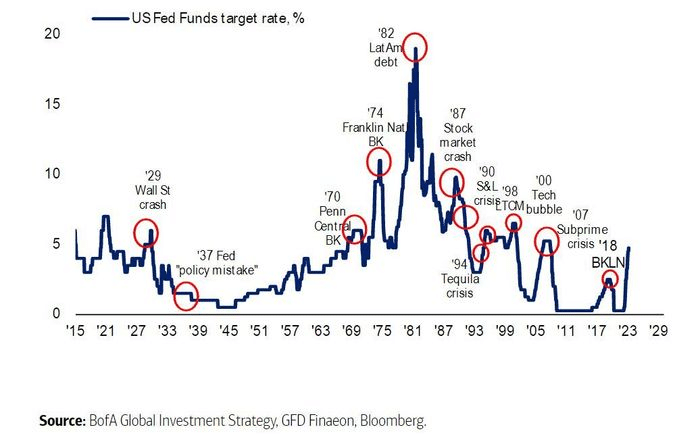
Click to expand.
Recession Question
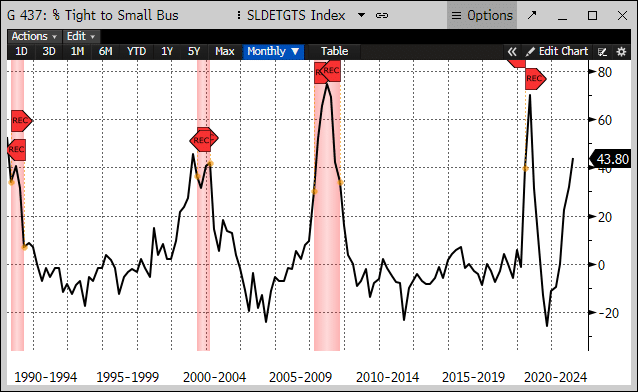
In addition to the financial “accidents” outlined in the chart on the prior page, Fed rate-hiking cycles are also often accompanied by recessions and that is the next logical question to discuss. Are we going to have a recession in the next twelve months? There are a number of signals that would seem to indicate yes. We have talked about the shape of the before – the fact that short interest rates are higher than longer-term rates (an inverted yield curve) which historically has signaled a recession. Another signal is tighter credit conditions.
So, if the odds favor a recession, why are stocks up for the last two quarters? First, the economy and the stock market are two different things. For example, while the US economy is predominantly domestic with only about 10% impacted by trade, the companies in the S&P 500 collectively have approximately 40% of their revenues generated from outside the US. This means the stock market can be much more influenced by the dynamics of global growth outside the US. Second, recall that we had a pretty severe correction in stocks last year, with the S&P 500 Index down over 27% from its peak to a low in October and the tech-heavy Nasdaq Composite Index down over 37% from peak to trough. One could infer that stocks perhaps anticipated some of the coming weakness and are now trying to look beyond it. That is a reasonable explanation.
However, it would be unusual for stocks to start to rally even before the recession has started. In addition, the S&P and Nasdaq may be a little misleading at the moment as these market capitalization weighted indices are heavily influenced by a small number of large names like Apple, Microsoft, Tesla, etc. We discuss this dynamic in more detail in our Stock Market overview, but suffice it to say, I think markets could remain range bound (in a wide range) as investors focus on the upcoming earnings season and the next moves by policymakers in the coming months.
Debt Ceiling
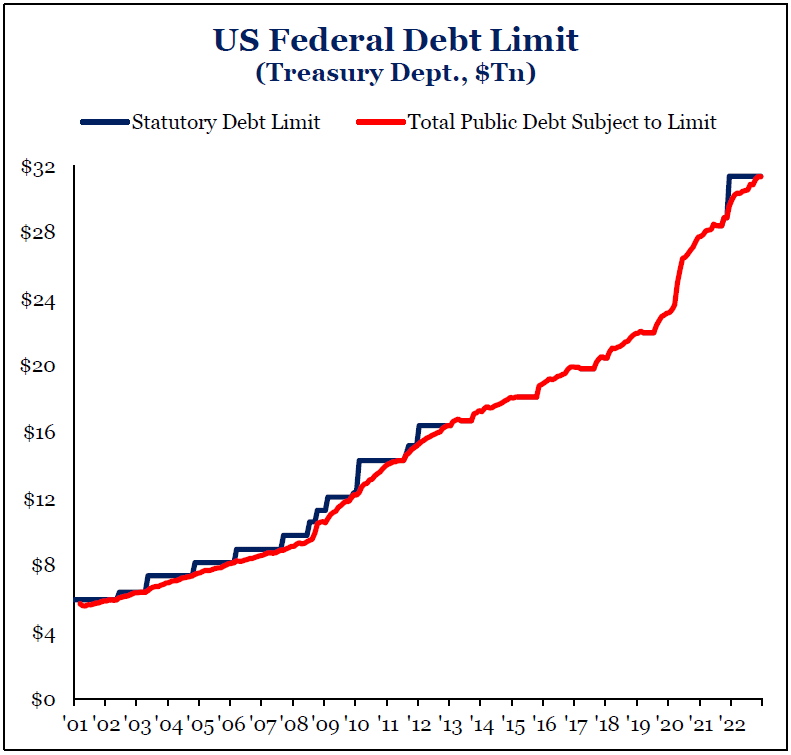
I wanted to provide an update on another topic we have discussed before with you and that is the US Debt Ceiling. Recall that we are approaching a point where the Debt Ceiling will need to be suspended or raised in order for the government to continue operating and paying its bills. This limit has been raised 61 times in the past 45 years, mostly without incident. However, the closer we get to the clock expiring, the more we risk unintended consequences, similar to what we saw in 2011, the last “showdown” the government had on raising this limit. The hope had been that cooler heads would prevail, particularly after the recent spate of volatility associated with the bank failures discussed earlier. However, we are not seeing any evidence of this yet from Washington. This is another dynamic we are monitoring closely with the help of our research partners at Strategas Research.
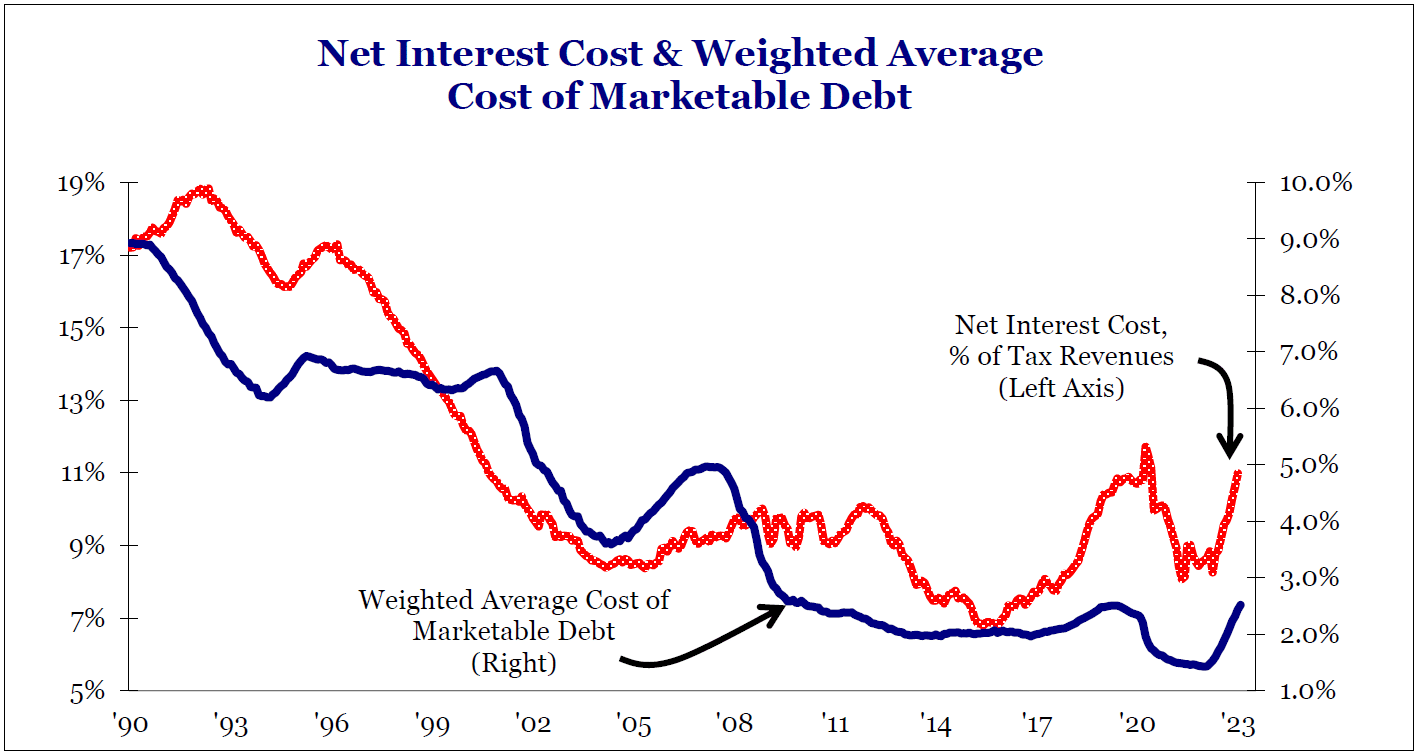
Assuming that we do get some resolution on this issue, there is the bigger question of why we have this ceiling to begin with. It has clearly not served a purpose for holding down spending by the government over time. One thing that may finally do that is the necessity of servicing all this debt at increasingly higher interest rates. The chart above right shows the weighted average cost of US debt (blue line, right axis) with net interest cost as a percent of total tax revenues (red line, left axis). Right now, about 10-11% of tax revenues go to servicing debt interest. As the 30% of US debt that matures in 2023 gets refinanced at higher rates, this percentage will quickly move toward 15% or higher. This occurred in the late 1980’s and early 1990’s and resulted in a series of legislation that was passed to rein in spending.
The Energy Deal Between China and Saudi Arabia
Stepping back from the US economy and financial markets for a minute, I wanted to touch on some global dynamics that may be off the radar but are nevertheless important. This past week the world saw the first energy trade settled in the Chinese yuan currency which took place with Saudi Arabia.
The relationship between the US and Saudi Arabia dates back 70 years with the US providing military support to the kingdom in exchange for its oil and transacting its oil trading globally in US dollars (the so-called “petro-dollar”).
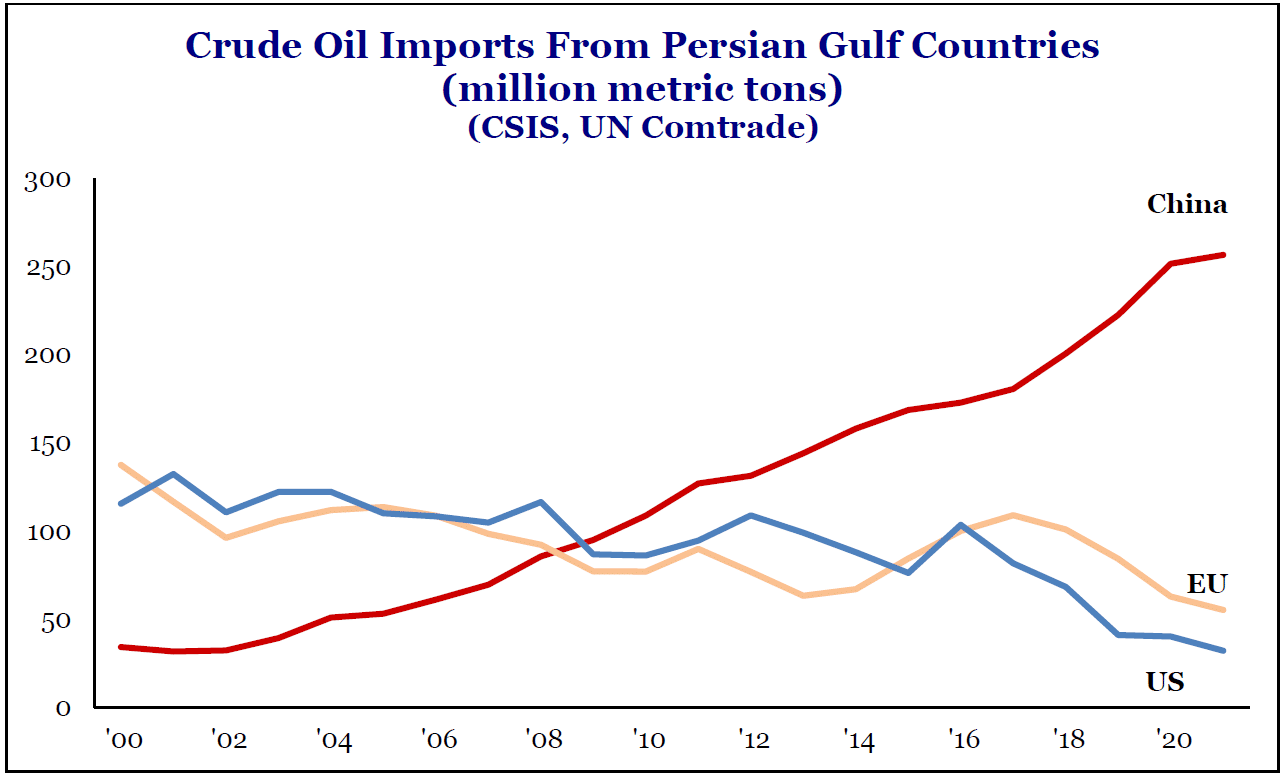
China has been working to crack this partnership, recently brokering a peace deal between historically sworn enemies, Iran and Saudi Arabia. In addition, Saudi Arabia is working on a security and free trade agreement with China. The chart on the left shows how China’s imports of oil from the Persian Gulf have grown dramatically over the past twenty years as the US and Europe have reduced their dependence on these resources.
We wrote last year about the changing global alliances that were forming coming out of Russia’s invasion of Ukraine. These changes are accelerating, and China is looking to take advantage of the dislocations being created due to global tensions. We are watching these developments closely as they will have implications on global financial markets and the US dollar. The concept of de-globalization, after 30+ years of a movement toward globalization, is probably overplayed in the short-term, but there is no question that a realignment of alliances and regionalization is developing at a rapid pace at the moment.
On a firm note, you will notice a new look to your statements this quarter as we have fully migrated to our new portfolio accounting system using Orion. We are very excited about the functionality of this system, including our new client and advisor portal as well as financial planning capabilities of the system. As with any new software transition, you may see information presented differently than you are accustomed to. If there is something you are not sure about on your statements or are not seeing something you used to see, please don’t hesitate to reach out to let us know. We look forward to integrating our new CRM system in the coming months as well which will allow us to serve you even better in the future. We have put out a number of written pieces and videos on our website over the past several months so please check out the Insights page for those resources.
On behalf of all the employees at Greenwood Capital,
Sincerely,
Walter B. Todd, III
President/Chief Investment Officer
The information contained within has been obtained from sources believed to be reliable but cannot be guaranteed for accuracy. The opinions expressed are subject to change from time to time and do not constitute a recommendation to purchase or sell any security nor to engage in any particular investment strategy. Investment Advisory Services are offered through Greenwood Capital Associates, LLC, an SEC-registered investment advisor.