

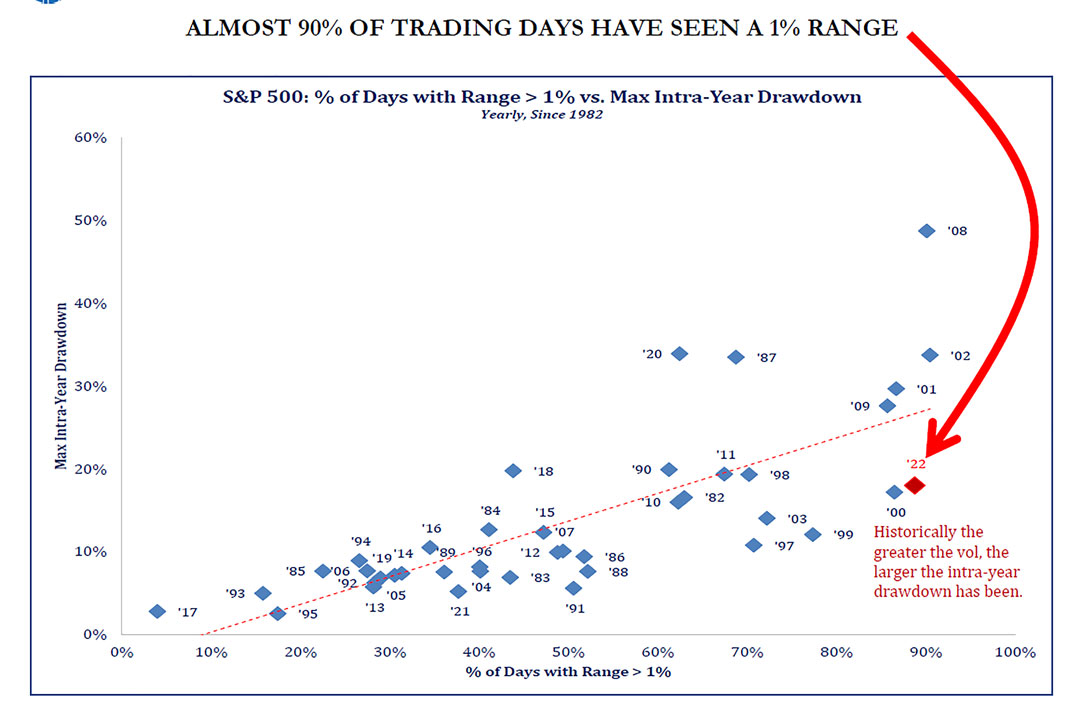
This line from Kenny Loggins’s Top Gun theme song, released in 1986, feels like an appropriate description of the market this year. I could not resist the connection with Top Gun 2: Maverick coming out this Friday, finally after a two-year delay in release. Coming into 2022, we talked about the likelihood of additional market volatility given the Federal Reserve’s renewed focus on fighting inflation. Then a war broke out in Europe and now we find ourselves with one of the more volatile years in recent memory, with nearly 90% of the trading days this year showing a 1% range in the S&P 500 (see chart below). So far the S&P 500 is down 18% from its all-time high reached in early January, but the average stock is down much more than that figure. The Russell 2000 Index for small-caps is down over 28% and the NASDAQ Index is down 30% from its high.
That is the past, what does the future hold? As Yogi Berra said famously, “It’s very tough to make predictions, especially about the future.” However, we know that as equity valuations have come down and interest rates have moved significantly higher, the outlook for forwarding returns in both stocks and bonds has improved. Is there more downside ahead? There could be at the index level. If you look at the Russell 1000 Index, over 42% of the companies in it are trading below their pre-Covid levels (February 2020) – they have unwound the entire move up of the past two years. Were the entire S&P 500 to do this, that would be another roughly 14% down from here.That is a downside scenario, where I think 3,700 or 3,750 might be a more likely downside target
That is the past, what does the future hold? As Yogi Berra said famously, “It’s very tough to make predictions, especially about the future.” However, we know that as equity valuations have come down and interest rates have moved significantly higher, the outlook for forwarding returns in both stocks and bonds has improved. Is there more downside ahead? There could be at the index level. If you look at the Russell 1000 Index, over 42% of the companies in it are trading below their pre-Covid levels (February 2020) – they have unwound the entire move up of the past two years. Were the entire S&P 500 to do this, that would be another roughly 14% down from here. That is a downside scenario, where I think 3,700 or 3,750 might be a more likely downside target (about 5% lower from current levels). In other words, the market has discounted a lot of bad news but could have some more work to do depending on how bad the news gets from here.
What we are seeing right now is an unquestionable slowdown in economic activity in the US over the past four to six weeks. We have heard this from numerous companies, including retailers like Amazon, Target, Walmart, and BestBuy. We have seen it in the recent economic data from regional Fed manufacturing surveys, as well as data points like New Homes Sales, which dropped by -16.6% year/year in April. Given national gas prices well over $4/gallon, higher food prices, and mortgage rates that have jumped from 3.25% to 5.25% in five months, I’m not sure we should be surprised by the slowing backdrop. Are we going to have a recession or maybe are we in one right now? It’s hard to envision a recession with a 3.6% unemployment rate, but could the NBER (National Bureau of Economic Research) declare a year from now that the first and second quarters of 2022 were a recession? Sure they could. We had negative growth in the first quarter and based on what we are hearing from companies right now, we could have negative growth in the current quarter (although the current outlook is for +1.8%). Whether we technically have (or are in) a recession is probably not as important as what the market has already discounted. As we noted above, depending on the index, it has discounted a good bit but could have more to go if the data proves worse than expected.
The other factor at play here is the Federal Reserve. At the beginning of the year, the market expected 3 quarter-point increases in rates from the Fed, today it anticipates another 7 (after they have already raised rates by 0.75% this year). Will the slowing of economic data and tightening of financial conditions be enough to slow inflation such that the Fed can be done raising rates sooner rather than later? Again, based on what we are seeing and hearing from companies as it relates to hiring and spending, it would seem likely the labor market will start to cool and upward pressure on inflation should begin to moderate as we move through the remainder of 2022. Another common question we get from clients revolves around the concept of Stagflation – that is low or no growth and high inflation. I would say technically we meet the definition right now, but the important question is how long do we stay there and when do we get out of that environment. The Fed is trying to get us beyond this circumstance right now through their policy of raising interest rates and tightening financial conditions to lower inflation (better late than never).
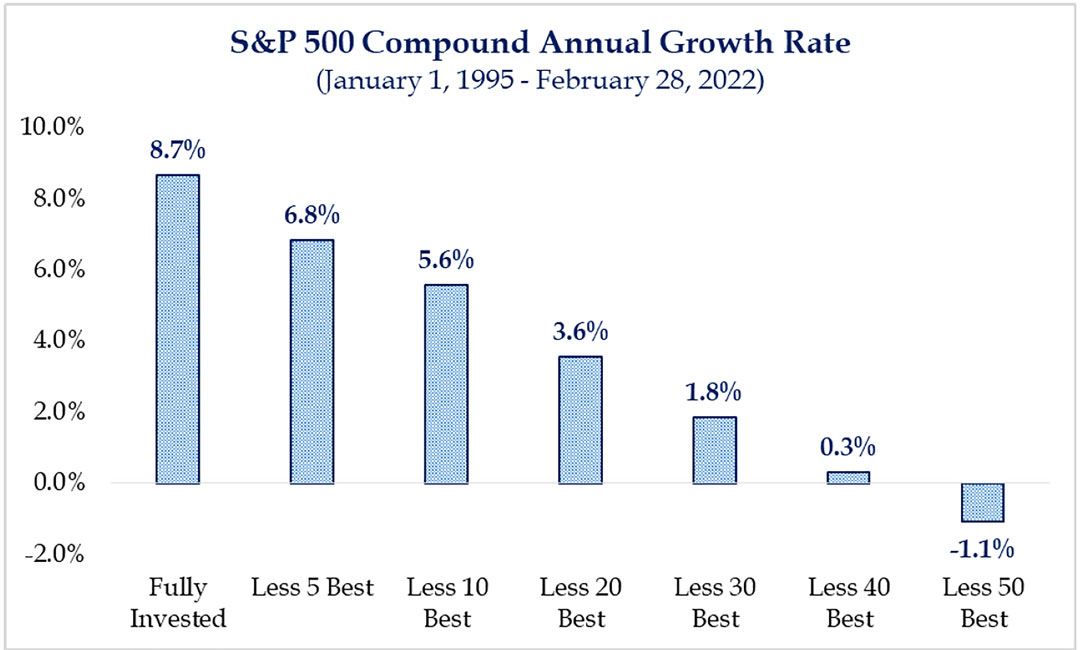
How do we navigate these circumstances? The answer to that question is very specific to each client and their unique needs and time frames, but in general we have done several things within our strategies to manage through this time. Within equities, we have generally overweighted those areas of the market that would benefit from the backdrop of inflation, including Energy and Materials. We have underweighted areas that are most at risk, including Technology and Consumer Discretionary. In addition, we have increased our weight in Healthcare as we believe this sector has a good combination of growth at a reasonable price (vs. other defensive areas like Consumer Staples and Utilities which seem relatively expensive). In fixed income, we have tried to maintain a balanced maturity, with bonds maturing to reinvest at higher rates while maintaining a high-quality portfolio of investment-grade corporate bonds. As we move through these volatile periods of time, it’s important to balance short-term cash needs with long-term goals. As the chart at right demonstrates, time in the market is more important than timing the market. The chart shows that the difference between being fully invested compared to missing the 50 best days in the market is a +8.7% annualized return vs. a -1.1% annualized return.
We will endeavor to continue to look for opportunities that are emerging during this sell-off that is becoming more indiscriminate and broad-based. Please do not hesitate to reach out to us should you have any questions or concerns. We are here to be your financial partner through good times and bad and help provide solutions to your financial needs. Please use us as a resource.
Sincerely,
Walter B. Todd
President|Chief Investment Officer