

July 6, 2022
Let me start by saying I hope that you and yours were able to enjoy July 4th and the long weekend. There has been no shortage of turmoil in and out of financial markets this year, but hopefully you were able to spend some time with friends and family.
The Market Commentary goes into the details of what happened this quarter and in the first half of 2022, but suffice it to say, it was ugly all around.
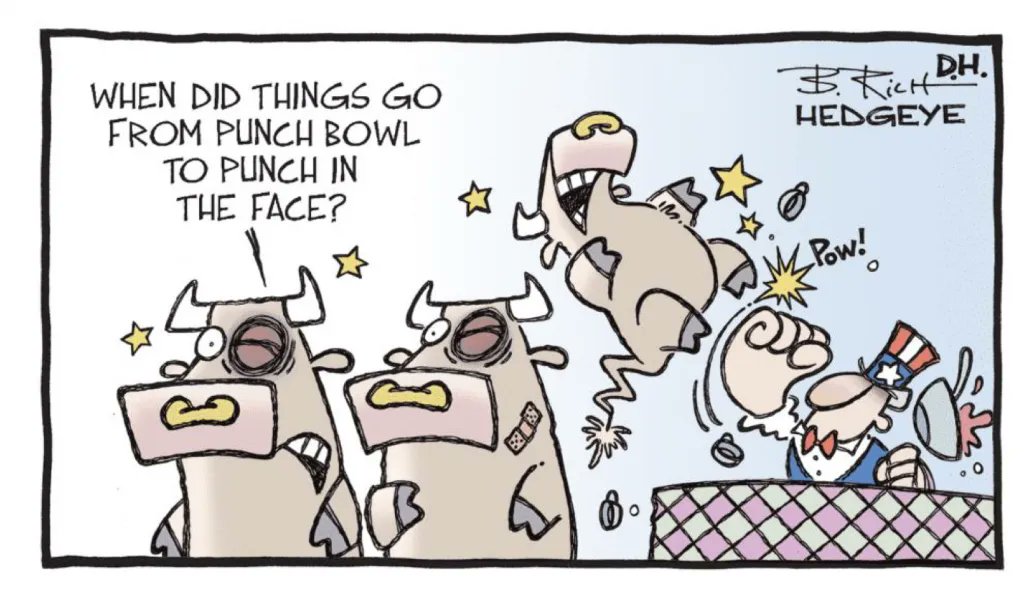
Stocks, bonds, digital currencies, no asset class was really spared from Jay Powell (aka Clubber Lang) and the Federal Reserve (Fed). To paraphrase the scene from Rocky III where Clubber is interviewed before the second fight with Rocky – “Clubber (Jay) what’s your prediction for the fight (financial markets)? Prediction? Yes, prediction. Pain.” While the quarter was not trending particularly well leading into June, the upside surprise in the Consumer Price Index (CPI) on June 10 and subsequent 75 basis point hike by the Fed on June 15 is what really seemed to push markets lower in the second half of the month. Interest rates initially spiked higher as you can see in the chart below but have since fallen significantly as concerns about inflation have transitioned to worries about a recession with softer economic data around the world. While we review the circumstances that got us where we are and possible historical parallels for insight, it’s important to remember there’s a reason they make the windshield much bigger than the rearview mirror. We need to focus on where we are going more than what is behind us. I must pause and give credit here to our own John Decker’s late mother, Nancy Decker, for that great insight.
I mentioned in my Stock Market Overview that this was the worst first half for the stock market since 1970. Any similarities between 1970 and 2022? Glad you asked, yes quite a few in fact. It was a mid-term election year; M2 (money) growth had contracted sharply, the core PCE measure of inflation was 4.7% and the US government was spending significant dollars on the Vietnam War. These are all nearly identical circumstances we face today except we are spending money on the war against Covid and now in aid to Ukraine. We also had a recession in 1970. Judging by the estimate for second quarter GDP by the Atlanta Federal Reserve (currently -2.1%), we may be in a recession now. What did stocks do in the second half of 1970? They rallied more than 25%. This is not a guarantee or even a prediction for the next six months of 2022, but interesting to note nonetheless. The chart below left shows how pervasive the fears of a recession have become. This is the story count on Bloomberg that mention the word recession.
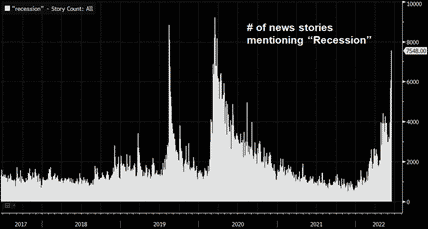
Story count on Bloomberg that mention the word recession
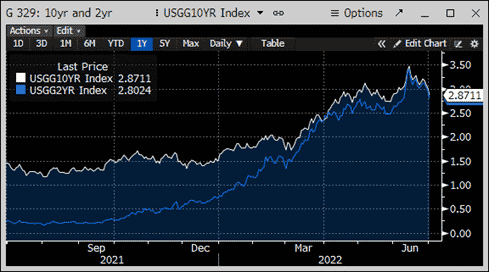
10 and 2 Year Rate
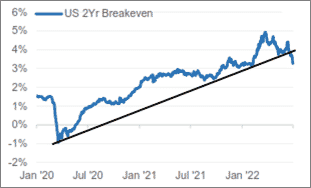
2 Year Breakeven Rates
Let’s spend a little more time diving into this shift in the market outlook from inflation to recession indicated by this chart. The charts above of 10-year and 2-year rates (center) falling is one clue of this change. Looking at other market signals, the following charts are instructive. The top right looks at 2-year inflation breakeven rates. Essentially this is where the market is predicting inflation will be in two years (looking ahead through that windshield!). This has fallen from 5% recently, down toward 3%.
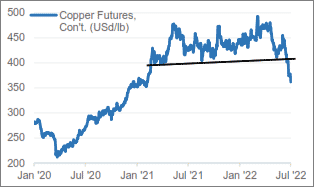
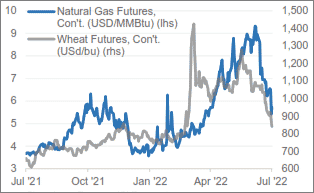
Next, we look at recent commodity price moves below. The right chart indicates Copper in one and Natural Gas and Wheat prices in the left chart (all courtesy of Evercore ISI). These market signals are reflecting the outlook for slower growth and/or recession. The stock market performance in June supported this view with the most economically sensitive areas of the market performing the worst and defensive areas like Consumer Staples and Utilities doing the best.
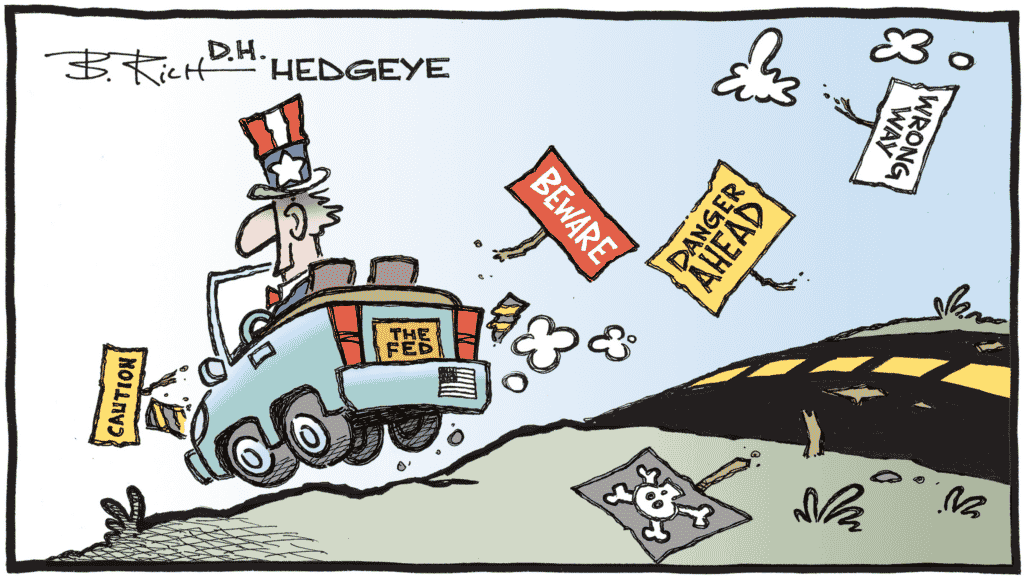
So, we have all these forward-looking indicators saying the same thing. Unfortunately, right now we have the Fed driving the car looking in the rearview mirror, focused on inflation. We all know what happens when you drive without looking forward – you tend to have a wreck and herein lies the problem for financial markets right now. Currently, the Fed Funds Rate is at 1.75% and according to the Fed projections, they see the need to take it to 4% (or higher) by the end of 2023 (see Mark Pyles’s Economic Overview). The market on the other hand (as reflected in the Fed Funds Futures) which is looking through the windshield and sees the flashing red lights, has them peaking around 3.4% and beginning to cut rates in March or May of 2023. Given the economic data flow recently, we believe even this market forecast for the peak in Fed Funds may be too high.
Regardless, a long-lasting bottom for stocks likely takes acknowledgement by the Fed of the weakness in the data and its implications for inflation in the future. We believe this could happen by the Fed’s meeting on September 21.
In addition to the data above, another big reason you see the calls for recession growing is consumer confidence. Using the University of Michigan measurement of this data reported for June we see the lowest level in the history of the series going back to 1978. Sitting down and watching thirty minutes of the local news, you can certainly understand the sentiment. However, at the same time, we are seeing huge crowds at airports and air travel approaching pre-pandemic levels in terms of TSA throughput. It seems that a boom in services demand is replacing the scramble for toilet paper two years ago. Still, it is worth noting that similar historical readings in the confidence shown in the adjacent chart from JP Morgan are associated with recessionary periods (gray shaded regions).
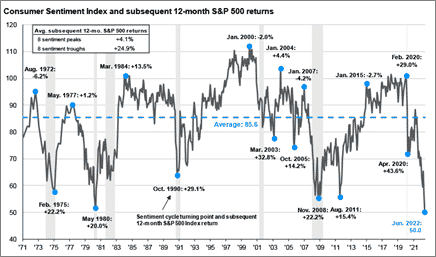
Importantly, however, these troughs in sentiment have also been associated with very positive forward returns for stocks.
The blue dots in the chart show the 12-month forward return of the S&P after such instances of troughs (and peaks).
Given this discussion, a natural question would be how much of this doom and gloom is reflected in stocks.
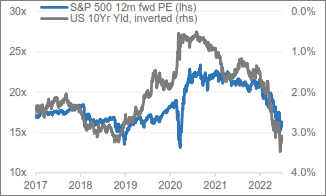
While we have seen a significant reset in valuations for stocks (see chart left showing P/E multiples falling from over 20x to around 16x), we are still looking for a reset in earnings estimates.
Companies could provide this as they begin to report earnings for 2Q22 in a few weeks. To be sure, we have seen glimpses of this from individual companies with the likes of Target (TGT) and Restoration Hardware (RH) in the retail space and Micron (MU) in semiconductors, but we have yet to see it on a broad level. Given the headwinds of higher rates, higher inflation and ongoing supply chain disruptions, it’s hard to imagine we don’t see some form of capitulation on the earnings outlook for the remainder of 2022 and for 2023. This will be an important step in resetting the market for the future.
I could continue to go on and on with data analysis, but perhaps the most pressing question you have is one that a very astute foundation board member asked me at our last meeting – what does this mean for our organization (or me individually)?
If we can look beyond the next six to twelve months to the next three, five and ten-year time frames, what this reset in valuations and interest rates means is a much-improved outlook for forward returns in both asset classes. While there is significant damage piling up behind us in the rearview mirror and possibly some congestion immediately ahead to navigate, looking over the horizon looks a little clearer. We are here to help you navigate this difficult period and enjoy the open road beyond the current pileup.
As always, we appreciate your continued confidence in our team and the support of our firm. We are here to be a resource for you, so please do not hesitate to reach out with any questions or concerns.
On behalf of all the employees at Greenwood Capital,
Sincerely,
Walter B. Todd, III
President/Chief Investment Officer
The information contained within has been obtained from sources believed to be reliable but cannot be guaranteed for accuracy. The opinions expressed are subject to change from time to time and do not constitute a recommendation to purchase or sell any security nor to engage in any particular investment strategy. Investment Advisory Services are offered through Greenwood Capital Associates, LLC, an SEC-registered investment advisor.