July 8, 2020
Let me start as I did last quarter by hoping this letter finds you and your family safe and healthy. Even though 2020 is only halfway over, I think it is safe to say that this year will go down in the record books – pick your reason as to why. Forty years ago, in February of 1980, sports broadcaster Al Michaels asked “Do you believe in miracles?” as the US Hockey team beat the highly-favored USSR team in the Winter Olympics in Lake Placid. I think I would ask the same thing today after witnessing the S&P 500 post the best second-quarter return in history on the heels of the worst first quarter. What happened?
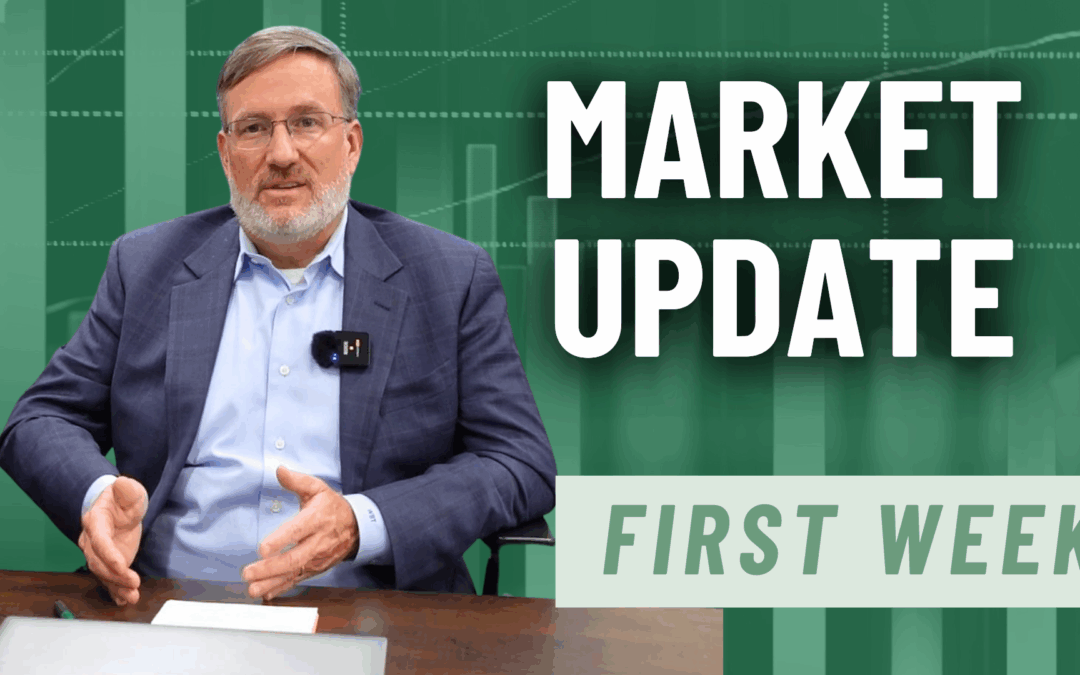
Well, I think I can sum up the rebound with two charts and one picture on this page. The picture (above) features the two main architects of the ‘Shock and Awe’ campaign to rescue financial markets in March, Fed Chairman Jay Powell and Treasury Secretary Steve Mnuchin doing the newly established elbow tap greeting.
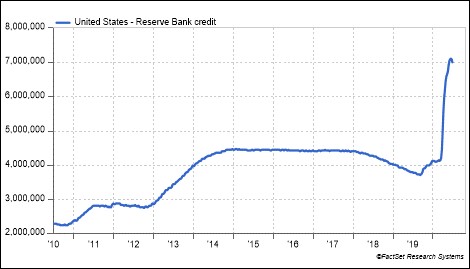
The Federal Reserve Balance Sheet (Source: FactSet Research Systems 6.30.2020)
The charts that accompany this picture are the Federal Reserve Balance Sheet (above) and the US Government deficit (below). The balance sheet reflects roughly $3 trillion in expansion over the past three months while the deficit reflects approximately $1.5 trillion of excess spending related to the CARES Act and other emergency programs. Just in case you were wondering, the increase in the market capitalization for the S&P 500 during the second quarter was roughly $5 trillion. I am sure this is a coincidence.
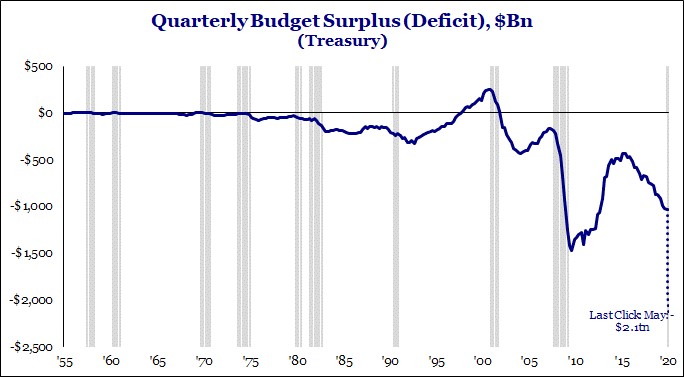
(Source: FactSet Research Systems 6.30.2020)
One of the hardest things to reconcile about the past three months has been the recovery in financial markets as we deal with an unemployment rate that is the highest in the last 80 years. To this point, policy markets have been able to build a bridge over the massive hole in economic growth created by the economic shutdown. The only question remaining is how long the bridge needs to be to get to the other side. Unfortunately, that is a function of the path of the virus and its impact on the economy, as well as the timing of a vaccine. All these areas: new cases, drug development, and reopening data, are a fluid. As we receive news daily, we monitor updates closely.
Speaking of the economic recovery, we questioned last time what shape that would take, U, V, W, etc.? The answer so far depends on how you look at the data. Take the employment market for instance. For April we got a jobs report showing a loss of 20 million jobs in one month; for May we saw the addition of 2.5 million. The first chart (below) shows these changes visually. Looks like a V.

U.S. Non-Farm Employment Market (Source: FactSet Research Systems 6.30.2020)
On the other hand, if we look at the same data, but this time in the form of total employed individuals in the US, see the chart to the right, it looks more like a fish hook with a magnifying glass needed. The reality is recovery will be somewhere in the middle.
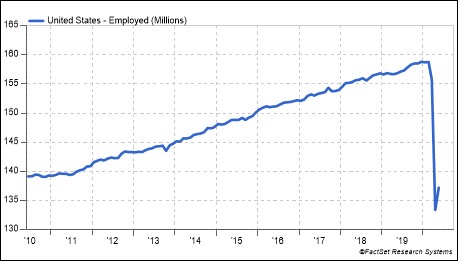
U.S. Total Employment (Source: FactSet Research Systems 6.30.2020)
We have definitely seen better than expected economic data come through over the last several months; and for financial markets, better or worse is more important than good or bad (with a nod to Liz Ann Sonders of Schwab). This “better” data has also provided a lift to markets during the most recent period. Does the data continue to build from here or start to level off? That’s what we are looking for – not only for the US but also for the rest of the world. It’s no secret that Asia and Europe have had much more success with keeping the virus at bay and therefore could be the beneficiary of a quicker recovery.
(Source: B. Rich, D. H. Hedgeye)
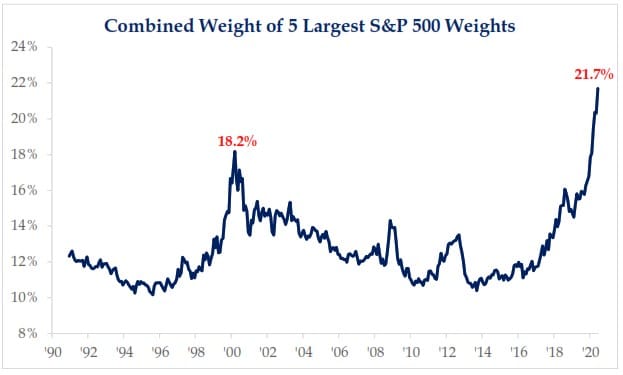
Despite the improvement in the economy, the performance of the market remains fairly concentrated in the larger index names, particularly those related to technology. We still see a yawning gap between the S&P 500 return, for example, at -3.1% YTD through 6/30/20 vs. the equal-weight S&P 500 at -10.8% or the S&P 600 small-cap index down -17.9% over the same period.
(Source: Strategas Research Systems 6.30.2020)
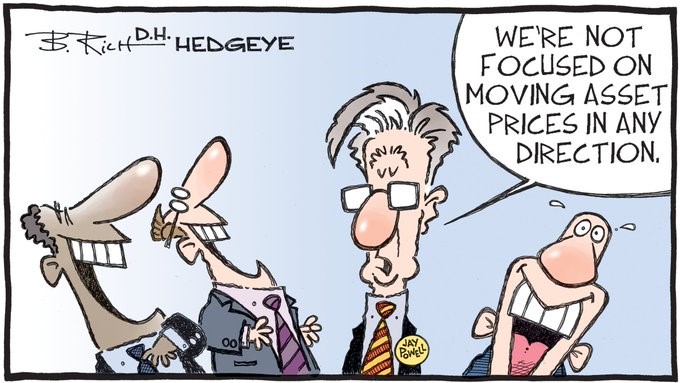
In other words, the average stock is fairing much worse than the headline indices. We would like to see that change as we move forward to provide a more durable market. In addition to this concentration risk, we have also noticed increased speculative behaviors recently. Bankrupt Hertz stock rallying over 200% in a few days would be one example, but also when we look at valuations in the market, we see many stocks trading in excess of 15-20x sales (yes sales). In some cases, you have very large names trading at 40-50x sales. I understand the desire for growth in a low growth world, but wow. Jay Powell says the Fed is not focused on moving asset prices in any direction, which I believe is not the intent of the Fed. But the evidence in financial markets would suggest they are, whether they like it or not.
(Source: Strategas Research Systems 6.30.2020)
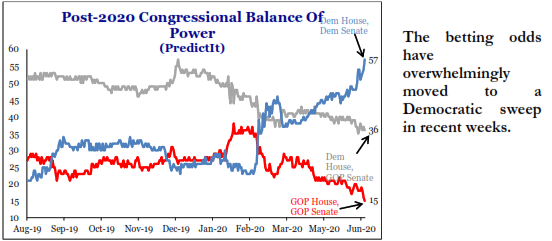
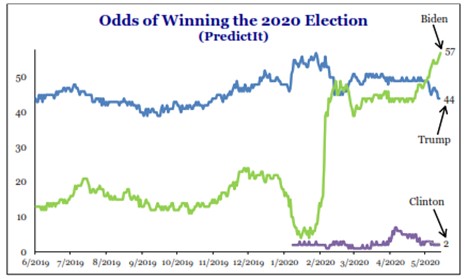
Believe it or not, there are just 123 days until the US election this year. With the virus and everything else going on in the world, this event has fallen from the headlines for a while. But heading into summer we see it is back in focus. If the election were held tomorrow, the outcome would very likely be a Democratic sweep of Congress and the White House based on the current polls (see charts above and below). But four months is a lifetime in politics and given all that 2020 has given us in the way of surprises, it is anybody’s guess at this point how this will turn out. One clue we can follow is the stock market.
The equity market, as measured by the S&P 500, has predicted whether the incumbent party wins or loses with fairly good accuracy (87%) since 1928. If the market is up in three months prior to the election, we probably keep the status quo, if it is down we are looking at a change. This market track record has to be juxtaposed with the fact that we did have a recession this year and no President has won reelection with a recession within two years of his election year. So, we shall see what happens. The outcome of both the Presidential race and the battle for Senate control (the House will remain Democratic) will have significant implications on tax policy, regulations, etc., so we are following this closely.
On a firm level, everyone here is healthy (knock on wood). We are still largely working remotely given the continued increases in cases, but we are of course easily reachable via email, telephone, or if necessary to meet in person as well. I hope you have found our routine communications helpful during this period as we have emailed periodic notes out on various topics, posted routine videos, and shared via social media on LinkedIn and Facebook. We are also pleased to announce all of these are now available on our website on the newly launched Insights page at www.Greenwood Capital.com/insights.
Thank you as always for your continued trust in Greenwood Capital.
We look forward to hearing from you.
On behalf of all the employees at Greenwood Capital,
Sincerely,
Walter B. Todd, III
President/Chief Investment Officer
The information contained within has been obtained from sources believed to be reliable but cannot be guaranteed for accuracy. The opinions expressed are subject to change from time to time and do not constitute a recommendation to purchase or sell any security nor to engage in any particular investment strategy. Investment Advisory Services are offered through Greenwood Capital Associates, LLC, an SEC-registered investment advisor.


